

ABC analysis- a method that allows you to classify a company's resources (the customer base is a resource) according to their degree of importance. This analysis is one of the methods of rationalization and can be applied to any enterprise and in any field of its activity.
The main goal of ABC analysis of the customer base is to identify in customer segments the groups of customers that provide the greatest contribution (80%) to the company's results in order to focus on best meeting the needs of this particular group.
By filling out the feedback form at the end of the article, you can receive a convenient Excel template for conducting ABC analysis.
definition
What is ABC analysis
At the core ABC analysis lies the Pareto principle: 20/80. When applied to ABC analysis of a customer base, the rule is as follows: 20% of a company’s total customers bring it 80% of its revenue. Another 15% of revenue comes from the next 30% of customers. And 50% of customers (half of the customer base) bring in only 5% of revenue. Depending on the industry and type of business, these numbers may fluctuate a little (there are also extreme cases when a business has only 1-2 clients), but the general statistics are exactly the same.
Evaluating clients based on the level of income generated is the simplest way to evaluate a company's clients, and companies often set up such an assessment in the accounting system. But, assessing only on the basis of the income brought by the client is insufficient. The company should be interested not just in revenue, but in how much profit it receives for each hryvnia of sales. Therefore, it is important to understand not only the revenue from a sale to a specific client, but also the marginal profit that the client brought to the company. The marginal profit must be determined taking into account all the costs associated with selling to this particular client. Quite often it happens that a client seems to buy a lot, but demands a maximum discount and additional conditions (delivery, or after-sales service, or bonuses). However, this customer's sales cycle is longer than for other customers, and the sales staff spends more time on him than on others. Therefore, it is advisable to evaluate the marginal income generated by the client per unit of time spent on each transaction. As a result, having counted all the costs associated with sales by such a client, it may turn out that these sales do not bring profit to the company.
In addition, the company should be interested in the question: what sales revenue does it receive for each hryvnia of capital used - a question of the efficiency of use of the company's capital. And this directly depends on the payment discipline of clients. Those. leads to the need to evaluate customer accounts receivable.
That is why we propose to use an extended version of the analysis - a simultaneous assessment of customer value based on revenue, marginal income, and several other indicators, selected depending on the specifics of the business and the company's strategy. For example, sales volumes, receivables maturity, frequency of purchases, dates of last purchase or revenue per transaction, etc.
Undoubtedly, a necessary condition for conducting a correct analysis is the correct keeping of sales records by customer segments, customer names, income received and taking into account all types of costs that the company incurs to attract, retain a customer, and after-sales service, if any. For such sales accounting, a well-developed methodology for management accounting in the company and its implementation in the IT system is required.
application area
Application area
In what cases is it used? ABC analysis
ABC analysis should be carried out at least once a year when developing and reviewing the company's strategy for the existing market in order to develop a marketing strategy and a sales strategy for existing customers. The analysis should also be carried out for medium-term (annual) sales planning: past sales to existing customers can serve as a basis for forecasting future sales. However, for many markets and types of businesses it is desirable to conduct ABC analysis more often - once a quarter - this will help quickly focus marketing and sales on the company's best clients.
How ABC analysis can be used in combination with other strategy tools
ABC analysis A powerful tool for analyzing the performance of a company's customer base, it represents only one component of a broad customer analysis process. Therefore, this tool should be used in conjunction with other strategic tools: strategic analysis of the client base, analysis of customer profiles, analysis of customer needs and behavior.
ABC analysis can be used not only for analyzing the customer base and identifying the best customers. It can be used to analyze product categories and nomenclature within a category to determine categories and products that are in greatest demand and most profitable, assess the effectiveness of sales managers, sales channels, partners, analyze inventories, raw materials and purchased materials, cost analysis, etc.
By combining customer analysis and product analysis, we obtain a cross-analysis that allows you to focus both on priority customers and on the items that priority customers choose.
step by step guide
How to put it into practice ABC analysis
Process ABC analysis consists of the following steps (see Fig. 1):
Fig.1 Process ABC analysis
Step 1 Selection of sales indicators for analysis and preparation of accounting data;
Step 2 Analysis of the effectiveness of customer segments;
Step 3 Analysis of segments for each sales indicator separately;
Step 4 Consolidation of assessment results for individual sales indicators into a single table;
Step 5 Analysis of the totality of all sales indicators;
Step 6 Drawing conclusions based on the results of the analysis and making management decisions.
The result of the ABC analysis process will give you a clearer understanding of who the company's most valuable customers are, generating the most revenue and profit. You will gain the basis for making informed management decisions to allocate your marketing budget to your most valuable customers; to focus the efforts of sales personnel (and other company personnel) on the most valuable customers; to further strategically develop a unique value proposition for its most valuable customers and strengthen the company's competitive position.
Step one: Selecting sales indicators for analysis and preparing accounting data
To carry out the analysis, you first need to select sales indicators by which the customer base will be assessed. These are, at their core, strategic sales metrics that a company has chosen to measure sales when developing a strategy. Typically this is revenue and contribution margin, plus maybe accounts receivable collection or sales volumes.
In addition, to carry out the analysis you will need preliminary data preparation. This is due to the fact that, as a rule, most companies have no order in their accounting. The same client can appear in accounting under different names. One of the reasons is that the client may have several legal entities to conduct business activities and execute transactions for different entities. The second reason is simple errors in introducing company names by sales personnel under different names due to the lack of management accounting standards in the company. It is enough to enter the client once as “Company”, the second time as LLC “Company”, the third time as LLC “Company”, and three clients will appear in the system instead of one.
Therefore, we upload data from the accounting system into an Excel table and analyze the names, compile a unique list of clients and summarize the sales of the same client. The results of this step can serve as the basis for bringing order to the accounting of sales to customers.
Step Two: Analyze the Performance of Customer Segments
Typically, a company works with several customer segments. Therefore, the first step is to analyze the contribution of each segment to the company's results. And then conduct further analysis of the customer base within each segment separately.
 Fig. 2 Contribution of segments to the overall result of the company
 Due to the fact that, as a rule, there are not many customer segments in a company (2-4), assessing their effectiveness is not very difficult and clear. By calculating the share of segment revenue in the company’s total revenue and the share of segment revenue in marginal sales profit, we can immediately draw certain conclusions. In the example shown in Figure 2, Segment 2 brings the company 32% contribution margin with revenue of less than 24%. And this is the highest priority segment. You need to pay attention to segment 1, since despite the largest share in sales revenue, it brings the company only about 22% of marginal income. Even closer attention needs to be paid to segment 4 - why this segment has such low marginal income.
Step Three: Analysis of segments for each sales indicator separately
Set the range of categories: ABC
 Fig.3 Ranges of ABC categories
 For each sales indicator, its own Excel spreadsheet is prepared. Let's consider the analysis using the example of the sales indicator “Revenue”. The analysis sequence is as follows:
We create a table;
We sort by sales indicator in descending order (in this case, by revenue);
We calculate the total amount of the sales indicator;
We calculate the “Share” column - the share of each client in the total sales indicator using the formula: (Revenue per client) / (Total revenue) * 100%;
We calculate the “Cumulative Total” column - the cumulative total of the clients’ share in revenue, starting from the highest value. For example, Client 14’s share of revenue is 29.89%, Client 10’s share of revenue is 26.55%, Client 13’s share of revenue is 6.09%. The cumulative total of the first three clients will be: Client 14 (29.89%) + Client 10 (26.55%) + Client 13 (6.09%) = 62.53%;
We assign categories ABC. We find a client whose share is cumulatively closer to 80%. This is the lower limit of category A. We find a client whose cumulative share is closer to 95%. This is the lower limit of category B. All clients below this limit belong to category C. We do conditional formatting by category: category A - green, category B - yellow, category C - red.
 Fig.4 Results of Step 3.
 Step four: Consolidation of assessment results for individual sales indicators into a single table
The results of the analysis of the previous step for each individual sales indicator are summarized in a general table. The table is sorted by priority indicator, for example, by revenue.
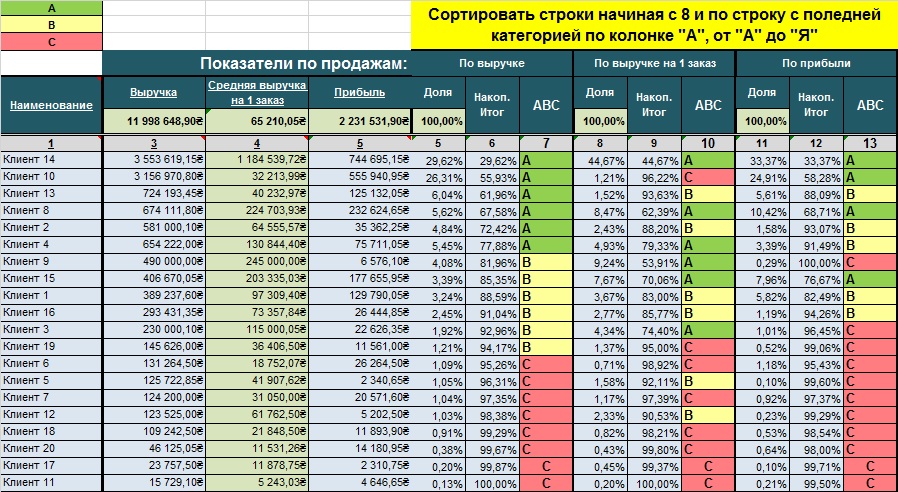 Fig. 5 Summary assessment of customers based on a set of sales indicators
 Step five: Analysis of the totality of all sales indicators
For clarity, we transfer the results to a table with assigned categories. The visual result obtained makes it possible to quickly make assessments and make management decisions. In the example given, we see that Clients 14 and 8 are the most valuable for the company in terms of both revenue and marginal profit. Client 10 brings a lot of revenue and profit to the company, but the size of each transaction with this client is small, i.e. he buys often, but in small quantities. Accordingly, in the time aspect, each transaction with it requires more resources from the company. If the company's accounting system took into account the marginal profit taking into account the expenditure of staff time on one transaction, most likely, in terms of marginal profit, this client would not fall into category “A”. Imperfections in a company's accounting system can lead to incorrect conclusions
 Fig. 6 Summary assessment of clients by aggregate of ABC categories
 There are a number of clients (Client 13, 2, 4) who fall into category “A” in terms of revenue, and category “B” in terms of marginal profit. This means that the company may be providing excessive discounts or additional free services to these customers. Client 15, with revenue in category “B”, falls into category “A” in terms of profit. This means that if efforts are made to increase sales to that customer, the company can generate additional profits proportionately greater than the increase in sales.
From the presented matrix it is also clear that half of the company’s clients fall into category C, i.e. in total brings the company less than 5% of revenue and profit.
A logical question arises: “What management decisions need to be made?”
These customers essentially drag the company down, diverting human and time resources that could be used more efficiently. In fact, those who rank at the bottom of your list are candidates for “fire,” as strange as that may sound.
Step six: Preparing conclusions based on the results of the analysis and making management decisions
No analysis makes sense if management decisions are not made based on its results. Sometimes there is an opinion that it is necessary to “bring up” those lagging behind in order to get more revenue and profit. But this is a wrong opinion. The company should focus on its most valuable, best customers who have proven that they already bring value to the company and can bring it in the future. The best clients are the ones that have generated the most revenue and profit in the last 12 months (or 24 months), and give you the highest hourly income/profit (the income they generate divided by the time you spend on them).
Decisions to make:
How can you better meet the needs of your most valuable customers to increase the revenue and profit they generate?
How to allocate your marketing budget to your most valuable customers?
How to distribute sales staff efforts?
It is imperative to separate customer segments and conduct analysis within the segments. Mixing customers of different segments in one analysis table will lead to incorrect assessment and incorrect management conclusions and decisions.
If a company sells its products in different geographic markets and operates in different industries, it is recommended to conduct an ABC analysis for each segment, each sales channel, each industry, for each market.
To obtain reliable estimates in ABC analysis, it is necessary to have reliable initial information in the accounting system. This requires a well-thought-out management accounting policy with detailed cost accounting and detailed sales analytics.
How to avoid mistakes associated with using ABC analysis
The most serious errors occur due to incorrect accounting data that incorrectly reflects the nuances of the company's business activities. Therefore, a necessary condition should be the development and implementation of a Management Accounting Policy with the greatest possible detail of costs associated with generating income and detailed sales analytics.
It is imperative to separate customer segments and conduct analysis within each segment.
It is not enough to analyze only revenue or only marginal profit. It is necessary to apply a cumulative assessment according to the strategic parameters of the company's sales.
restrictions
What are the advantages and disadvantages of ABC analysis
In order to get maximum benefit from ABC analysis it should be used throughout the organization on a regular basis to ensure that any sales trends can be identified and responded to in a timely manner.
Like all other methods ABC analysis has its advantages and disadvantages.
Advantages
Provides a simple, easy-to-use, and visual template for analyzing a company's customer base;
ABC analysis provides an economic assessment of each customer to determine their value to your business;
Flaws
Takes into account exclusively the company’s previous statistics (dynamics may change in the future);
Depends on the quality of accounting information: a well-thought-out management accounting methodology and the availability of detailed sales analytics;
Companies often simplify the analysis and conduct it based on only one sales indicator, which can lead to incorrect conclusions;
The process must be carried out regularly to be effective. However, companies often do not do this, believing that it requires significant time (and therefore money);
To make strategic decisions, it is recommended to use ABC analysis in combination with the method of strategic assessment of the client base, which complements the quantitative indicators of ABC analysis with qualitative expert assessments of the strategic importance of clients for the future development of the company.
For getting MS EXCEL ABC Analysis Template You must complete and submit the following form.
The ABC analysis method is based on the principle of classifying products according to their importance to the company's profit. This type of analysis is one of the methods for optimizing inventory balances and can be used in the field of activity of any trading enterprise.
ABC analysis is based on the Pareto principle - 20% of all goods produce 80% of turnover. One of the main ideas of the analysis is that controlling 20% of positions allows you to control 80% of revenue.
ABC analysis is widely used due to its versatility, efficiency and ease of understanding. As a result of ABC analysis, products are rated according to the degree of influence on the overall result.
Sales volumes are analyzed according to two parameters: sales volume (quantity sold) and profit received (realized trade margin).
ABC analysis is based on the Pareto rule, according to which 20% of assortment items provide 80% of the profit.
ABC analysis - analysis of inventory by dividing into three categories:
A- the most valuable, 20% of inventory; 80% of sales
IN— intermediate, 30% of inventory; 15% of sales
WITH- least valuable, 50% of inventory; 5% of sales
The product assortment analysis module calculates and indicates categories for each product item in the selected product category. The result of the calculation is the placement of a letter identifier opposite the name of the goods.
Group A- very important products that should always be present in the assortment. If sales volume was used as a parameter in the analysis, then this group includes the sales leaders by quantity. If trade margin was used as a parameter in the analysis, then this group includes the most profitable products.
Group B- goods of medium importance.
Group C- the least important products are candidates for exclusion from the assortment and new products.
Calculation of product ownership is the determination of the current position of the product, a reflection of the current contribution of this product to the overall result.
After calculating group membership, enterprise management can decide to optimize the assortment.
If the goal is to reduce the assortment, then sales volume and profit are selected as the main parameters.
If the goal is to identify and reduce the costs of maintaining inventories, then the turnover ratio, the volume of illiquid stock and the occupied warehouse capacity are selected as the main parameters.
If you want to study profitability, then the turnover ratio and the level of profitability are selected as the main parameter.
ABC analysis data helps you make informed decisions to optimize your product range.
Benefits of ABC Analysis
Simplicity.
The main advantage is ease of use. The simpler the method, the more reliable it is - this is an axiom. The simple method is easier to understand and easier to use for analysis.
Transparency.
The simpler, the more reliable and understandable. The ABC analysis method involves relatively simple calculations that are easy to check if necessary.
Versatility.
Another important advantage is its almost complete versatility. Using the ABC method, you can analyze both the turnover within a product category and the product categories themselves and their contribution to the activities of a trading enterprise. In addition to ranking products, you can analyze suppliers to determine the supplier's contribution to the financial result of the store.
Resource optimization.
Optimization is the goal of the method. Successful use of ABC analysis allows you to reduce and free up a huge amount of time and financial resources. This is achieved by concentrating work on the most important elements.
Disadvantages of ABC Analysis
ABC analysis, like any other statistical method, is not artificial intelligence that thinks for people. ABC analysis is a tool in the hands of the analyst. Constantly calculating indicators when generating Supplier Requests alerts employees to changes in ratings, but it is the operator's responsibility to decide what actions need to be taken.
First drawback- This is a one-dimensional method. This method allows you to build a rating either by the product’s contribution to revenue, or to the markup, or to the number of sales (turnover). This drawback is overcome by using multidimensional ABC analysis, when grouping is carried out according to several indicators at once.
Second drawback follows from the method of overcoming the first drawback. For analysis using several criteria, groups A, B and C are determined by several variables at once. As a result, 2 indicators are formed. The number of possible groups is 9 (nine). The maximum number of groups is determined by the number of possible combinations of ABC groups according to two indicators (AA, AB, AC, BA, BB, BC, CA, CB, CC).
If an element falls into group CA, then this means that according to the first criterion it corresponds to group C, according to the second - to group A. If the element falls into group AB, then according to the first criterion - A, according to the second - B, etc. As you can see, there can be 9 groups in total. The highest priority positions are in the AA group, the least priority ones are in the SS. The interpretation of all groups and the decisions made in this regard depend entirely on the nature of the data and the goals of the analysis. For three indicators, the number of groups already reaches 27. The interpretation of such calculations is already not so simple and requires additional actions when making decisions.
Third drawback is a rating of goods regardless of their quality characteristics. It would be more correct to say that this is a traditional analyst mistake. If the rating is calculated based on sales of a large assortment, which includes several brands or goods with different consumer properties (dairy, meat, groceries, bread, etc.). If, when calculating indicators, we mix all this and carry out an ABC classification, it turns out that in each group there will be positions that are completely incomparable with each other. With this calculation, grouping will have no practical meaning. Groups are identified so that they can be managed, but how can you manage goods that are completely different in their properties?
Therefore, before conducting ABC analysis, it is necessary to divide goods into product categories, groups that are similar in nature.
Fourth disadvantage: among the goods there may be not only those that sell poorly, but also those that do not sell at all or that are sold at a loss. That is, goods that cause damage worse than group C. For this, another group is often added - D. This results in an ABCD analysis. Or here's another example. Group A included 40-50% of the assortment, which in absolute terms can be quite a lot. Then from group A we can select group A+, which will include the very best positions.
The three groups A, B and C are not always able to qualitatively separate the data, so additional groups are often added that are not provided for in the classic version.
Fifth disadvantage: lack of seasonality. This disadvantage applies to all methods of statistical analysis. By making changes to the assortment matrix, the company strives to influence future sales. And all calculations are based on past data.
It often happens that some items fall out of sales. This happens for various reasons: the supplier does not have them, a procurement error, etc. Then it turns out that the product has not been sold for some time and the total sales volume will be lower than potentially possible. If this is a position from group A, then according to the calculation results it can easily fall into group B or even C.
To reduce the impact of the fifth drawback, it is recommended to remove from the calculations those periods when the product was unavailable, and also use shorter periods of time for analysis.
ABC analysis has advantages over other methods, which are expressed in simplicity, versatility and easy implementation.
The problems of the method, first of all, are that ABC grouping by one indicator does not always correctly prioritize. When using multivariate ABC analysis, the number of elements in group A can be significantly more than 20%. ABC analysis cannot recognize the quality and nature of the data; this must be done by the analyst before making calculations.
ABC analysis is based on the Pareto 80/20 rule. This rule can be interpreted for any occasion in life and business. Many people try to live by this principle, discarding 80% of what is unnecessary and taking care of 20% of what is important. Some even have success in this regard. And so the Pareto rule can be interpreted as follows:
- You spend 80% of the time in a meeting discussing and 20% of the time making decisions.
- 20% of customers make 80% of revenue
- 20% of the assortment brings 80% of the profit
This ratio applies to almost any situation where 20% is important and 80% is not important. In trading there is the following distribution:
- A - the most valuable, 20% of the assortment; 80% - sales
- B - intermediate, 30% - assortment; 15% - sales
- C - least valuable, 50% - assortment; 5% - sales
Remember that you cannot remove products from group C! You will simply lose revenue. Profit is made up of each product, from sales of the entire assortment. What you have in group C should not be deleted, but you should rotate the assortment or add new products to the product matrix if conditions permit. ABC will be recalculated depending on sales, so you can control sales.
For high-quality control of sales and search for weak positions in the product matrix, ABC analysis must be carried out not for the entire product matrix, but for the product classifier. If you do not have a classifier, I strongly recommend developing one. You will be able to analyze Product groups, product subgroups and product types. For example, a product that falls into category C across the entire product matrix may end up in category A in its product subcategory. In this case, it is necessary to pay attention to group C in this subcategory, find out the reasons for low sales and make a decision on this product. If a product in the form of a product has group A, but group C does not exist at all, the conclusion is very simple, you need to expand the range in this type of product.
Calculation of ABC analysis
Now I will show you how you can create an automatic ABC analysis calculation in Excel. I developed this technique back in 2005 and still use it today.
Friends, who have no time to read and understand what is written below, I suggest downloading a ready-made ABC analysis template (bonus for ABC analysis - XYZ analysis) All you have to do is substitute your data
For any sales analysis, it is necessary to take several time periods, at least three. For example, three months, three years, three weeks. The more periods, the more accurate the result. And so we take three periods of sales of something, and we get the following plate:
|
Classifier |
Name of product |
||||
|
Product type 1 |
|||||
|
Product type 1 |
|||||
|
Product type 1 |
|||||
|
Product type 1 |
|||||
|
Product type 1 |
|||||
|
Product type 1 |
|||||
|
Product type 1 |
|||||
|
Product type 1 |
|||||
|
Product type 2 |
|||||
|
Product type 2 |
|||||
|
Product type 2 |
|||||
|
Product type 2 |
|||||
|
Product type 2 |
|||||
|
Product type 1 |
|||||
|
Product type 1 |
Now we need to find out how much was sold for all periods, many would simply put the sum, but we will use the function = INTERMEDIATE TOTAL (9; set the range of values from the first value to the end of the sheet). Where 9 means the number of the addition function. We place this formula above your sign. Because The quantity of goods may vary. Here's what happens:
|
Classifier |
Name of product |
||||
|
Product type 1 |
|||||
|
Product type 1 |
|||||
|
Product type 1 |
|||||
|
Product type 1 |
|||||
|
Product type 1 |
|||||
|
Product type 1 |
|||||
|
Product type 1 |
|||||
|
Product type 1 |
|||||
|
Product type 2 |
|||||
|
Product type 2 |
|||||
|
Product type 2 |
|||||
|
Product type 2 |
|||||
|
Product type 2 |
|||||
|
Product type 1 |
|||||
|
Product type 1 |
Now you need to calculate the share of each product from the sales totals, well, it’s easy here. We divide the total of each product by the total of the entire assortment:
|
Classifier |
Name of product |
|||||
|
Product type 1 |
||||||
|
Product type 1 |
||||||
|
Product type 1 |
||||||
|
Product type 1 |
||||||
|
Product type 1 |
||||||
|
Product type 1 |
||||||
|
Product type 1 |
||||||
|
Product type 1 |
||||||
|
Product type 2 |
||||||
|
Product type 2 |
||||||
|
Product type 2 |
||||||
|
Product type 2 |
||||||
|
Product type 2 |
||||||
|
Product type 1 |
||||||
|
Product type 1 |
Next, we sort the entire table by the “total” column, data in descending order. After which we create another column “Cumulative totals” with the formula = INTERMEDIATE TOTAL(9; (range of Values), where the upper value of the “Share cell” is fixed by pressing F4, the lower value is the last line of the book)
|
Classifier |
Name of product |
Cumulative total |
|||||
|
Product type 1 |
|||||||
|
Product type 1 |
|||||||
|
Product type 1 |
|||||||
|
Product type 1 |
|||||||
|
Product type 1 |
|||||||
|
Product type 1 |
|||||||
|
Product type 1 |
|||||||
|
Product type 1 |
|||||||
|
Product type 2 |
|||||||
|
Product type 2 |
|||||||
|
Product type 2 |
|||||||
|
Product type 2 |
|||||||
|
Product type 2 |
|||||||
|
Product type 1 |
|||||||
|
Product type 1 |
That's practically all! Now we can enter ABC; to do this we need to insert the formula:
IF(I3>0.8;"C";IF(I3>0.5;"B";"A"))
Where I3 is the cumulative total column.
|
Classifier |
Name of product |
Cumulative total |
||||||
|
Product type 1 |
||||||||
|
Product type 1 |
||||||||
|
Product type 1 |
||||||||
|
Product type 1 |
||||||||
|
Product type 1 |
||||||||
|
Product type 1 |
||||||||
|
Product type 1 |
||||||||
|
Product type 1 |
||||||||
|
Product type 2 |
||||||||
|
Product type 2 |
||||||||
|
Product type 2 |
||||||||
|
Product type 2 |
||||||||
|
Product type 2 |
||||||||
|
Product type 1 |
||||||||
|
Product type 1 |
Now, if you set a filter, you will be able to filter the classifier, and all calculations will be automatically calculated, and you will not need to make new tables for each product group. Convenient, reliable and practical.
|
Classifier |
Name of product |
Cumulative total |
||||||
|
Product type 1 |
||||||||
|
Product type 1 |
||||||||
|
Product type 1 |
||||||||
|
Product type 1 |
||||||||
|
Product type 1 |
||||||||
|
Product type 1 |
||||||||
|
Product type 1 |
||||||||
|
Product type 1 |
||||||||
|
Product type 1 |
||||||||
|
Product type 1 |
In the next article I will tell you about XYZ analysis and how to combine it with ABC analysis.
Dear friends!
Who needs a ready-made template with all the formulas, I suggest downloading it for a nominal fee (bonus to ABC analysis - XYZ analysis in one form) All you have to do is enter your data. Download the ABC and XYZ template for a nominal fee.
One of the key methods of management and logistics is ABC analysis. It can be used to classify enterprise resources, products, customers, etc. by degree of importance. Moreover, according to the level of importance, each of the above units is assigned one of three categories: A, B or C. The Excel program has in its luggage tools that make it easier to carry out this type of analysis. Let's figure out how to use them and what ABC analysis is.
ABC analysis is a kind of improved version of the Pareto principle adapted to modern conditions. According to the methodology for conducting it, all elements of the analysis are divided into three categories according to the degree of importance:
- Category A– elements that together have more than 80% specific gravity;
- Category B– elements, the totality of which ranges from 5% before 15% specific gravity;
- Category C– the remaining elements, the totality of which is 5% and less specific gravity.
Some companies use more advanced techniques and divide elements not into 3, but into 4 or 5 groups, but we will rely on the classic ABC analysis scheme.
Method 1: analysis using sorting
In Excel, ABC analysis is performed using sorting. All elements are sorted from largest to smallest. Then the cumulative specific gravity of each element is calculated, on the basis of which it is assigned a certain category. Let's use a specific example to find out how this technique is used in practice.
We have a table with a list of goods that the company sells and the corresponding amount of revenue from their sale for a certain period of time. At the bottom of the table is a summary of the total revenue for all items of goods. The task is, using ABC analysis, to divide these products into groups according to their importance for the enterprise.

- Select the table with the data with the cursor by holding down the left mouse button, excluding the header and the summary line. Go to the tab "Data". Click on the button "Sorting" "Sorting and Filter" on the tape.

You can also do it differently. Select the table range indicated above, then move to the tab "Home" and click on the button "Sorting and Filter" located in the toolbox "Editing" on the tape. A list is activated in which we select a position in it "Custom sorting".
- When you apply any of the above actions, the sorting settings window opens. Let's look at the parameter "My data contains headers" the checkbox has been checked. If it is missing, we install it.
In field "Column" indicate the name of the column that contains revenue data.
In field "Sorting" you need to specify by what specific criterion the sorting will be performed. Leave the default settings - "Values".
In field "Order" set a position "Descending".
After making the specified settings, click on the button "OK" at the bottom of the window.
- After completing the specified action, all elements were sorted by revenue from highest to lowest.
- Now we need to calculate the specific weight of each of the elements for the overall total. For these purposes, we create an additional column, which we will call "Specific gravity". In the first cell of this column we put the sign «=»
, after which we indicate a link to the cell in which the amount of revenue from the sale of the corresponding product is located. Next we set the division sign ( «/»
). After this, we indicate the coordinates of the cell that contains the total amount of sales of goods throughout the enterprise.
Considering the fact that we will copy the specified formula to other cells of the column "Specific gravity" using a fill marker, then we need to fix the address of the link to the element containing the total amount of revenue for the enterprise. To do this, we make the link absolute. Select the coordinates of the specified cell in the formula and press the button F4. As we can see, a dollar sign appears in front of the coordinates, indicating that the link has become absolute. It should be taken into account that the reference to the amount of revenue of the first product in the list ( Product 3) must remain relative.
Then, to make calculations, click on the button Enter.
- As you can see, the share of revenue from the first product listed in the list is displayed in the target cell. To copy a formula into the range below, place the cursor in the lower right corner of the cell. It transforms into a fill marker that looks like a small cross. Click the left mouse button and drag the fill marker down to the end of the column.
- As you can see, the entire column is filled with data characterizing the share of revenue from the sale of each product. But the specific gravity value is displayed in a numerical format, and we need to transform it into a percentage. To do this, select the contents of the column "Specific gravity". Then move to the tab "Home". On the ribbon in the settings group "Number" There is a field displaying the data format. By default, if you have not made any additional manipulations, the format should be set there "General". Click on the triangle icon located to the right of this field. In the list of formats that opens, select a position "Percentage".
- As you can see, all column values have been converted to percentages. As expected, in the line "Total" indicated 100% . The share of goods is expectedly arranged in a column from largest to smallest.
- Now we need to create a column that displays the accumulated share with a running total. That is, in each line, the specific gravity of all those goods that are located in the list above will be added to the individual specific gravity of a particular product. For the first product in the list ( Product 3) the individual share and the accumulated share will be equal, but for all subsequent ones, the accumulated share of the previous element of the list will need to be added to the individual indicator.
So, in the first line we move it to the column "Accumulated share" column indicator "Specific gravity".
- Next, place the cursor in the second cell of the column "Accumulated share". Here we will have to apply the formula. We put up a sign "equals" and add the contents of the cell "Specific gravity" the same line and the contents of the cell "Accumulated share" from the line above. We leave all links relative, that is, we do not perform any manipulations with them. After this, click on the button Enter to display the final result.
- Now you need to copy this formula into the cells of this column, which are located below. To do this, use the fill marker, which we already resorted to when copying the formula in the column "Specific gravity". At the same time, the line "Total" there is no need to capture, since the accumulated result in 100% will be displayed on the last product in the list. As you can see, all the elements of our column were filled in after that.
- After this we create a column "Group". We will need to group products into categories A, B And C according to the specified accumulated share. As we remember, all elements are distributed into groups according to the following scheme:
- A- before 80% ;
- B– the following 15% ;
- WITH- remaining 5% .
Thus, all goods whose accumulated share of specific gravity falls within the limit of up to 80% , assign a category A. For goods with an accumulated specific gravity of 80% before 95% assign a category B. The remaining group of products with a value of more than 95% of the accumulated share we assign a category C.
- For clarity, you can fill these groups with different colors. But this is optional.


Thus, we divided the elements into groups by level of importance using ABC analysis. When using some other methods, as mentioned above, division into a larger number of groups is used, but the principle of division itself remains practically unchanged.
Method 2: Using a Complex Formula
Of course, using sorting is the most common way to perform ABC analysis in Excel. But in some cases it is necessary to carry out this analysis without rearranging the rows in the source table. In this case, a complex formula will come to the rescue. For example, we will use the same source table as in the first case.
- We add a column to the original table containing the name of the goods and the proceeds from the sale of each of them "Group". As you can see, in this case we may not add columns for calculating individual and cumulative shares.
- Select the first cell in the column "Group", and then click on the button "Insert Function" located next to the formula bar.
- Activation in progress Function Wizards. Moving to category "Links and Arrays". Selecting a function "CHOICE". Clicking on the button "OK".
- The function arguments window is activated CHOICE. Its syntax is presented as follows:
SELECT(Index_number;Value1;Value2;…)
The task of this function is to output one of the specified values, depending on the index number. The number of values can reach 254, but we only need three names that correspond to the categories of ABC analysis: A, B, WITH. We can immediately enter into the field "Value1" symbol "A", in field "Value2" — "B", in field "Value3" — "C".
- But with the argument "Index number" you will have to tinker a lot, building several additional operators into it. Place the cursor in the field "Index number". Next, click on the icon that looks like a triangle to the left of the button "Insert Function". A list of recently used operators opens. We need a function SEARCH. Since it is not in the list, we click on the inscription "Other functions...".
- The window is launched again Function Wizards. Let's go back to the category again "Links and Arrays". We find a position there "SEARCH", select it and click on the button "OK".
- SEARCH. Its syntax is as follows:
MATCH(Lookup_value;Lookup_array;Match_type)
The purpose of this function is to determine the position number of the specified element. That is, exactly what we need for the field "Index number" functions CHOICE.
In field "Browsing Array" You can immediately set the following expression:
It should be in curly braces, like an array formula. It is not difficult to guess that these numbers ( 0 ; 0,8 ; 0,95 ) indicate the boundaries of the accumulated share between groups.
Field "Matching Type" not mandatory and in this case we will not fill it out.
In field "Search Value" set the cursor. Next, again through the triangle-shaped icon described above, we move to Function Wizard.
- This time in Function Wizard move to category "Mathematical". Select a name "SUMMESLI" and press the button "OK".
- The function arguments window opens SUMIF. The specified operator sums cells that meet a certain condition. Its syntax is:
SUMIF(range, criterion, sum_range)
In field "Range" enter the column address "Revenue". For these purposes, place the cursor in the field, and then, holding the left mouse button, select all the cells of the corresponding column, excluding the value "Total". As you can see, the address is immediately displayed in the field. In addition, we need to make this link absolute. To do this, select it and press the button F4. The address is highlighted with dollar signs.
In field "Criterion" we need to set a condition. Enter the following expression:
Then immediately after it we enter the address of the first cell of the column "Revenue". We make the horizontal coordinates in this address absolute by adding a dollar sign from the keyboard in front of the letter. We leave the vertical coordinates relative, that is, there should not be any sign in front of the number.
After that, don’t press the button. "OK", and click on the name of the function SEARCH in the formula bar.
- Then we return to the function arguments window SEARCH. As we see, in the field "Search Value" the data specified by the operator appeared SUMIF. But that is not all. Go to this field and add the sign to the existing data «+» without quotes. Then enter the address of the first cell of the column "Revenue". And again we make the horizontal coordinates of this link absolute, and leave the vertical coordinates relative.
- Like last time in the launched Function Wizard looking for the required operator in the category "Mathematical". This time the function we are looking for is called "SUM". Select it and click on the button "OK".
- The operator arguments window opens SUM. Its main purpose is to summarize data in cells. The syntax for this operator is quite simple:
SUM(Number1;Number2;…)
For our purposes, we only need the field "Number1". Enter the coordinates of the column range into it "Revenue", excluding the cell that contains the totals. We have already carried out a similar operation in the field "Range" functions SUMIF. As before, we make the coordinates of the range absolute by selecting them and pressing the key F4.
After that, press the button "OK" at the bottom of the window.
- As you can see, the complex of introduced functions performed a calculation and produced the result in the first cell of the column "Group". The first product was assigned a group "A". The complete formula we used for this calculation is as follows:
SELECT(MATCH((SUMIF($B$2:$B$27,">"&$B2)+$B2)/SUM($B$2:$B$27);(0:0.8:0.95)) ;"A";"B";"C")
But, of course, in each specific case the coordinates in this formula will be different. Therefore, it cannot be considered universal. But, using the guide given above, you can insert the coordinates of any table and successfully apply this method in any situation.
- However, that's not all. We performed the calculation only for the first row of the table. To completely fill a column with data "Group", you need to copy this formula to the range below (excluding the row cell "Total") using the fill marker, as we have done more than once. Once the data has been entered, the ABC analysis can be considered completed.


As you can see, the results obtained using the option using a complex formula do not differ at all from the results that we carried out by sorting. All products are assigned the same categories, but the rows have not changed their initial position.

Excel can make ABC analysis much easier for the user. This is achieved by using a tool such as sorting. After this, the individual share, the accumulated share is calculated and, in fact, divided into groups. In cases where changing the original position of the rows in the table is not allowed, you can use a method using a complex formula.
ABC analysis
ABC analysis- a method that allows you to classify a company's resources according to their importance. This analysis is one of the methods of rationalization and can be applied in the field of activity of any enterprise. It is based on the Pareto principle - 20% of all goods produce 80% of turnover. In relation to ABC analysis, the Pareto rule may sound like this: reliable control of 20% of positions allows 80% control of the system, be it stocks of raw materials and components, or the product range of the enterprise, etc. Often ABC analysis confused with ABC method, deciphering ABC as Activity Based Costing, which is fundamentally wrong.
ABC analysis - analysis of inventory by dividing into three categories:
- A - the most valuable, 20% - inventory; 80% - sales
- B - intermediate, 30% - inventory; 15% - sales
- C - least valuable, 50% - inventory; 5% - sales
Depending on the purposes of the analysis, an arbitrary number of groups can be identified. Most often there are 3, less often 4-5 groups.
In essence, ABC analysis is the ranking of an assortment according to various parameters. In this way, you can rank suppliers, warehouse stocks, buyers, and long periods of sales - everything that has a sufficient amount of statistical data. The result of ABC analysis is the grouping of objects according to the degree of influence on the overall result.
ABC analysis is based on the principle of imbalance, during which a graph is constructed of the dependence of the cumulative effect on the number of elements. This graph is called a Pareto curve, Lorenz curve or ABC curve. Based on the results of the analysis, assortment items are ranked and grouped depending on the size of their contribution to the total effect. In logistics, ABC analysis is usually used to track shipment volumes of certain items and the frequency of requests for a particular product range, as well as to rank customers by the number or volume of orders they place.
Procedure for ABC analysis
- We determine the purpose of the analysis (why do you actually need this analysis?).
- We determine actions based on the results of the analysis (what will we do with the results obtained?).
- We select the object of analysis (what will we analyze?) and the analysis parameter (by what criteria will we analyze?). Typically, the objects of ABC analysis are suppliers, product groups, product categories, and product items. Each of these objects has different description and measurement parameters: sales volume (in monetary or quantitative terms), income (in monetary terms), inventory, turnover, etc.
- We compile a rating list of objects in descending order of the parameter value.
- We calculate the share of the parameter from the total sum of parameters with a cumulative total. The share with a cumulative total is calculated by adding the parameter to the sum of the previous parameters.
- We select groups A, B and C: we assign group values to the selected objects.
There are about ten methods for identifying groups, the most applicable of them are: the empirical method, the sum method and the tangent method. In the empirical method, the division occurs in the classic proportion of 80/15/5. In the sum method, the share of objects and their total share in the result are added up - thus the value of the sum is in the range from 0 to 200%. The groups are distinguished as follows: group A - 100%, B - 45%, C - the rest. The advantages of the method are greater flexibility. The most flexible method is the tangent method, in which a tangent is drawn to the ABC curve, first separating group A and then C.
The probabilities of demand for material resources A, B and C are subject to different laws. It has been established that in most industrial and trading companies, approximately 75% of the cost of sales volume is only about 10% of the items in the product range (group A), 20% of the cost - 25% of the items (group B), 5% of the cost - 65% of the items (group C) . There are many ways to identify groups in ABC analysis.
The ABC method is widely used in planning and forming an assortment at various levels of flexible logistics systems, in production systems, supply and distribution systems.
Experts advise caution when shifting the boundaries of ABC groups (80/15/5), the fact is that in practice the divisions of 80% 15% and 5% are usually used. If you shift the boundaries, an external listener (or an expert) may draw incorrect conclusions based on the indicators you provide, for example, for group “C”. Since his expectations about group “C” = 5% will not coincide with the rules for selecting groups that you changed.
see also
Literature
- Sterligova A. N., “Inventory management of a wide range of products. Where to start?”, LogInfo magazine dated 12.2003
- Andrey Fisher, “Methods for identifying groups in ABC analysis,” Logistics and Management magazine, No. 1-2008
Links
Wikimedia Foundation. 2010.
See what "ABC analysis" is in other dictionaries:
An operational management tool used to identify key customers, products, product groups for the purpose of analysis, monitoring and development of effective business solutions. It is based on the Pareto principle: 20% of all goods produce 80% of turnover... Dictionary of business terms
- ... Wikipedia
Classification of receivables by degree of importance and control methods, in which all debtors are divided into three categories depending on the value of the receivables: A the most valuable, B intermediate, C the least... ... Financial Dictionary
ABC is a multi-valued abbreviation with similar spellings in different languages. May have the following meanings: Contents 1 Cyrillic 2 Latin 2.1 Television ... Wikipedia
Linkage analysis of three factors- * analysis of the coupling of three factors * three point test cross is a method of genetic analysis that determines the presence or absence of linkage between three genes and their relative position in the case of linkage (see). For this purpose they receive... ... Genetics. encyclopedic Dictionary
analysis (metallurgy)- analysis The procedure for mental or real division of an object (process, phenomenon), the properties of an object (objects) or the relationship between objects into parts (signs, properties, relationships). The reverse procedure is synthesis. Analytical methods... ... Technical Translator's Guide
As an independent system, there is algebra in the broad sense of the word, which considers all quantities as unknown numbers, using letters instead of arithmetic signs of numbers. Including in mathematical mathematics the doctrine of equalities, which constitutes... ... Encyclopedic Dictionary F.A. Brockhaus and I.A. Ephron
- ... Wikipedia
ABC analysis is a method that allows you to classify a company's resources according to their importance. It is based on the Pareto principle: 20% of all goods produce 80% of turnover. In relation to ABC analysis, the Pareto rule may sound like this: reliable control 20%... ... Wikipedia
FMR (abbreviation for Fastest Medium Rare fast, medium, slow) analysis of the product range by frequency of calls/takes. Sometimes the terms are also used: FSN (English: Fast moving, Slow moving, Non Moving) and FNS... ... Wikipedia
Books
- SWOT analysis and synthesis are the basis for the formation of corporate strategy, Uchitel Yu.G.. In the process of solving the problems of crisis management today and effective design of the future, the Light system of methods (SWOT analysis and synthesis, strategic road map, GAP analysis, ...